python으로 web application을 제작하였고 그곳에서 통계 데이터를 이용해서 그래프를 그리는 Plotly에 대해서 설명하고자 합니다.
https://plotly.com/graphing-libraries/
python 은 아래 링크에서 이용하시면 됩니다.
설치
$ pip install plotly==5.17.0
or conda:
$ conda install -c plotly plotly=5.17.0
만약 web 서비스가 없다면 Plotly charts in Dash 항목을 읽어보고 Dash 를 추가로 설치 하면 됩니다.
여기 예제는 이미 web 서버 환경이 있다는 가정에서 하는것이기 때문에 Dash를 설치 하지 않도록 하겠습니다.
로컬에서 테스트 코드 실행시켜보기
plotly 를 설치했다면 아래와 같은 코드만으로도 실행되는 것을 볼 수 있습니다.

실행시키면 web sever 처럼 페이지 URL이 자동으로 열리고 random하게 특정 port 에 열리게 됩니다.
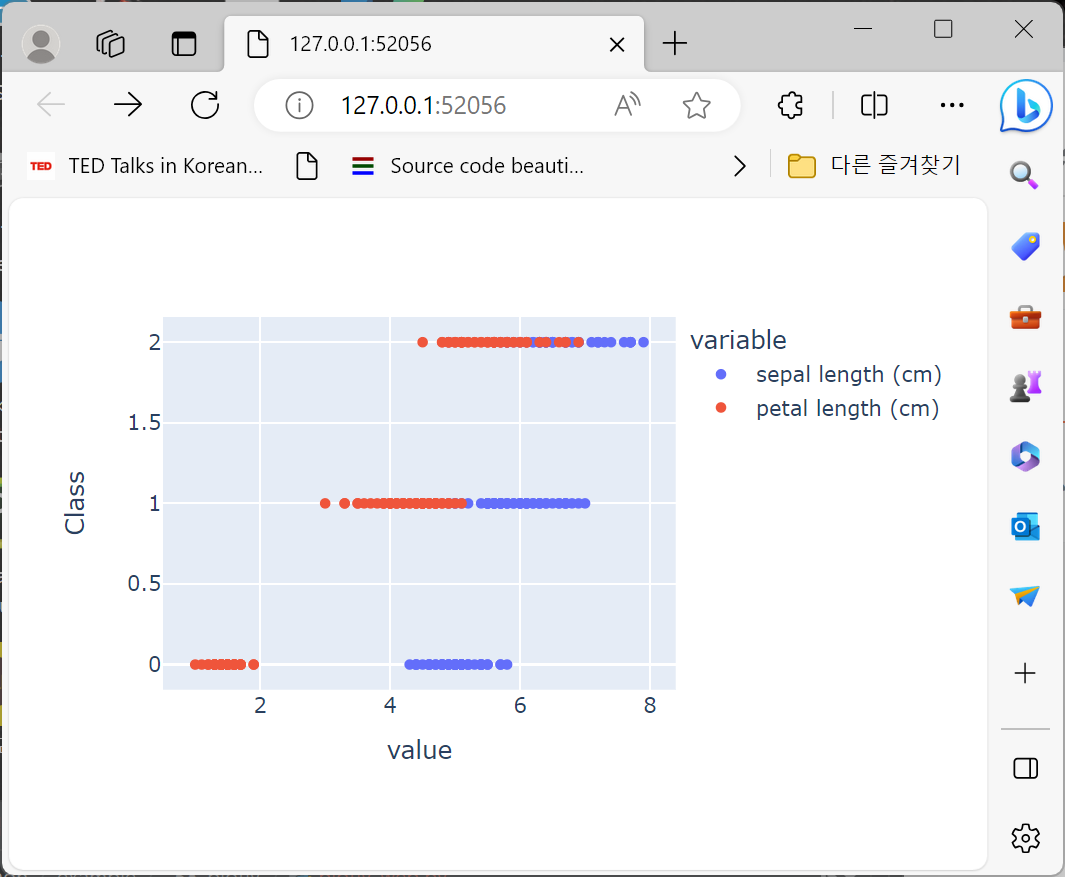
dataframe 과 mix해서 그려보기
import pandas as pd
from sklearn.datasets import load_iris

iris = load_iris()
iris = pd.DataFrame(iris.data, columns=iris.feature_names)
iris["Class"] = load_iris().target

import plotly.express as px
fig = px.scatter(iris, x=["sepal length (cm)", "petal length (cm)"], y="Class")
fig.show()
HTML 코드로 출력하기
to_html() 함수를 사용하면 html 코드를 구할 수 있습니다.
import plotly.express as px
fig = px.scatter(iris, x=["sepal length (cm)", "petal length (cm)"], y="Class")
html_code = fig.to_html()
print(html_code)
그래프 여러개 출력하기
출력된 html 을 여러개 합치면 되겠지만 단순하지 않습니다.
to_html에서 결과로 나오는 출력에는 head 와 script 정보가 모두 포함되어 표시 됩니다.
따라서 head 부분은 따로 구현해주고 to_html에서는 헤더 부분을 빼고 출력 부분들만 모아 주도록 해야합니다.
https://plotly.com/python-api-reference/generated/plotly.io.to_html.html
import plotly.express as px
html_code = ""
fig = px.scatter(iris, x=["sepal length (cm)"], y="Class")
html_code += fig.to_html(include_plotlyjs=False, full_html=False)
fig = px.scatter(iris, x=["petal length (cm)"], y="Class")
html_code += fig.to_html(include_plotlyjs=False, full_html=False)
print(html_code)
include_plotlyjs=False, full_html=False 옵션을 사용해서 헤더와 불필요한 부분을 빼줍니다.
출력
<div> <div id="01d35061-d537-4f9c-9060-bb234bb1de3b" class="plotly-graph-div" s
python으로 구성된 web 서비스를 이용해서 구현
예제를 하기 위한 것이니 간단하게 Flash를 가지고 web server를 동작시키겠습니다.
작업된 전체 코드 입니다.
import pandas as pd
from sklearn.datasets import load_iris
import plotly.express as px
from flask import Flask

app = Flask(__name__)


@app.route("/")
def index():
    html_code = '''
    <head>
    <script src="https://cdn.plot.ly/plotly-2.26.0.min.js" charset="utf-8"></script>
    </head>
    '''

    html_code += get_graph()
    return html_code


def get_graph():
    iris = load_iris()
    iris = pd.DataFrame(iris.data, columns=iris.feature_names)
    iris["Class"] = load_iris().target

    html_code = "<H1>Graph test</H1>"
    fig = px.scatter(iris, x=["sepal length (cm)"], y="Class")
    html_code += fig.to_html(include_plotlyjs=False, full_html=False)
    fig = px.scatter(iris, x=["petal length (cm)"], y="Class")
    html_code += fig.to_html(include_plotlyjs=False, full_html=False)
    return html_code


if __name__ == "__main__":
	app.run(port=8080, debug=True)
실행 화면


댓글 없음:
댓글 쓰기